TL;DR
Fixing a missed N+1 query led me into Enola's TypeScript extractor. After simplifying the code, we profiled it. Much of the time went to searches that could never match. Removing that work cut extraction on a NestJS app from 1.9 seconds to 0.8 seconds.
- Detection: Enola went from flagging no I/O inside loops to flagging 43 high-severity cases in a NestJS + Drizzle app. These included every N+1 query we found by reading the code. It also linked all 170 mobile API calls to backend routes, up from 158.
- Structure: the TypeScript extractor's four most complex functions became easier to follow. Their cyclomatic complexity—a count of independent paths through the code—fell from 78, 77, 49 and 47 to 13, 12, 4 and 7.
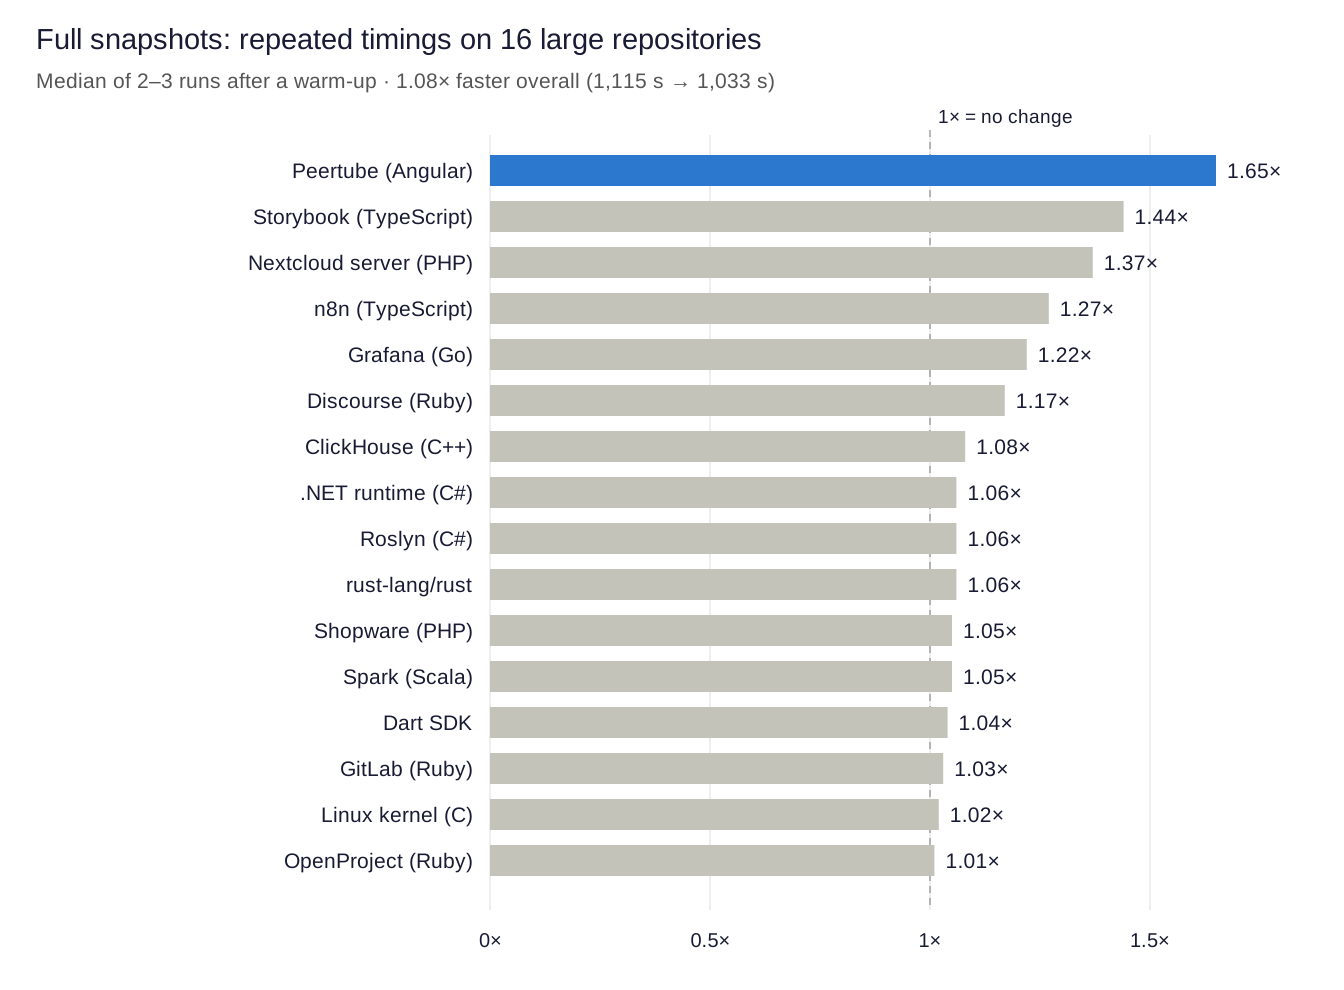
- Speed: TypeScript extraction is 1.3–3.6× faster across 16 repositories, with byte-identical output: the results matched exactly, down to every byte. Repeated full-snapshot runs on 16 large repositories show gains of up to 1.65× on Angular and 1.2–1.4× on TypeScript-heavy repositories. Together, the 16 took 1,033 s instead of 1,115 s: a 1.08× speedup.
- Verification: We ran the full benchmark on 124 public repositories. Findings went from 51,355 to 51,353, with no new labelled regressions. We checked every changed repository and fixed mistakes in our own code before release. Repeated timings on the 16 largest repositories found that none got slower.
It started with a real app
Enola indexed a production NestJS + Drizzle monorepo in 5.2 seconds and reported 51 performance risks, but not one database call inside a loop. That was the finding I expected most.
A plain scan for await inside loops turned up 136 candidates, and reading the code confirmed real N+1s. The worst was a user-facing endpoint that ran about nine queries per item.
Enola's own facts showed why it missed them:
- Drizzle wasn't recognised as database access. Enola recognised Prisma and TypeORM calls, but missed Drizzle's query-builder chains, such as
db.select().from(t). Only 47 functions were marked as doing I/O, and all of them were HTTPfetchcalls. - I/O stopped at interfaces. The app calls
OrderRepository.savethrough an interface; the class behind it runs the SQL. Enola did not carry that I/O information back through the interface, so it missed the database work. - Some mobile API calls did not link to backend routes. Indexing the Flutter client alongside the backend linked 158 of its 170 API calls. All 12 missed routes were collection roots such as
/v1/me, because the NestJS routes were recorded without the app's global/v1prefix.
Extending the extractors
After four changes, Enola flagged 43 high-severity cases of I/O inside loops. These included every N+1 query we had found by reading the code.
- Drizzle queries from their builder chains. A call counts as a query only as a pair:
fromon the result ofselect(…),valuesoninsert(…),setonupdate(…),whereondelete(…), orexecute(sql…).Array.fromandObject.valuesnever match, because their receiver is not a builder call. Drizzle is now also found in workspace packages, not only the rootpackage.json. - I/O through interfaces. When a call targets an interface member that has no fact of its own, Enola follows it to the implementing classes and records the answer on the interface (
io_members). The performance analyzer then treatsOrderRepository.savein a loop as confirmed I/O. - NestJS global prefix. A literal
app.setGlobalPrefix('v1')is now applied to every controller route, but only when every call in the codebase agrees and passes no options. A prefix read from the environment still leaves routes untouched. - Dart Retrofit clients are network calls. The abstract
@GET/@POSTmethods of a Retrofit client now count as I/O, so a Flutter data source calling one in a loop can be reported.
Two coverage-report fixes came out of the same session. A backend whose calls all resolve to its own routes is no longer labelled a "coverage gap", and enola coverage --unresolved now lists each unresolved call site with file and line.
| Measure (NestJS + Drizzle app) | Before | After |
|---|---|---|
| Functions recognised as doing I/O | 47 | 511 |
| Functions that call I/O through other functions | 231 | 1,320 |
| High-severity call-in-loop findings | 0 | 43 |
| Mobile API calls linked to backend routes | 158 / 170 | 170 / 170 |
| Backend coverage classification | coverage_gap (false alarm) | connected |
Dogfooding: Enola on Enola
Adding those features meant passing one more parameter through functions that already took 13. Before adding more, I wanted to see where the complexity was. We ran Enola on its own repository.
Enola indexed itself in about 11 seconds. Its TypeScript extractor held 460 functions with a total cyclomatic complexity of about 4,000, and ten functions at 40 or above. The worst four sat on the hot path every TypeScript file goes through:
extractNode(78): one switch over every kind of declaration.tsBodyWalker.walk(77): one switch over every node in every function body.Extract(49): about 15 repository-wide passes inline.extractFile(47): 16 parameters, seven of them framework booleans, and six return values.
Each new feature meant editing one of these functions. Reviewing another change inside a function with cyclomatic complexity of 78 was getting difficult.
Refactoring with Enola as the safety net
The refactor ran in three steps, and after each one the extractor produced byte-identical facts on five real TypeScript repositories, about 52,000 facts in all.
The check was simple: extract each repository before and after, sort the output, compare the bytes. A refactor that changed one relation on one symbol in those repositories would have failed it.
- Plumbing. The per-repository state became one
repoCtxvalue and call resolution onecallScope, replacing parameter lists of 10–16 arguments. - Phases.
Extractbecame a sequence of named steps: detect frameworks, partition files, read, extract per file, assemble, compose repository-wide passes, emit coverage and module facts. - One handler per node kind.
extractNodeand the body walk now dispatch to small functions for classes, members, variables, exports, loops, calls and iterator callbacks.
| Function | Complexity before | After |
|---|---|---|
extractNode | 78 | 13 |
tsBodyWalker.walk | 77 | 12 |
Extract | 49 | 4 |
extractFile | 47 | 7 |
No new function has a complexity score above 13. The total for the package barely changed: the same decisions were still there, spread across smaller functions. Each piece can now be read, tested and reviewed on its own. Extraction time stayed about the same.
Making it fast
A CPU profile of extraction on the largest app showed that most of the time went to searches in files that could never match. On a NestJS app with 20,000 facts, extraction fell from 1.9 s to 0.8 s.
- Regexes on files that cannot match (39% of CPU). Express/Fastify router detection ran five whole-file regexes three times per file, even on React components. Each pattern now runs only if the file contains the text it needs, such as
express,Routerorrequire(. Shared results are computed once, when first needed. - A C→Go callback per allocation (14%). The go-tree-sitter binding routes every allocation inside the C parser through a Go callback that then calls
malloc. Using tree-sitter's own libc allocator removes that round trip for every tree-sitter language Enola parses. - Repeated tree walks. Searches for Kafka imports,
require()calls and constant literals now skip files and function bodies that do not contain the words they look for. - The same directory search, nine times. Each framework detector searched for the TypeScript root on its own. On ClickHouse, a large C++ tree, that search went eight levels deep each time. It now runs once.
For each performance change, we compared the extracted facts before and after. The initial TypeScript checks matched byte for byte. The full benchmark below extended that comparison to more repositories and caught a bug those checks had missed.
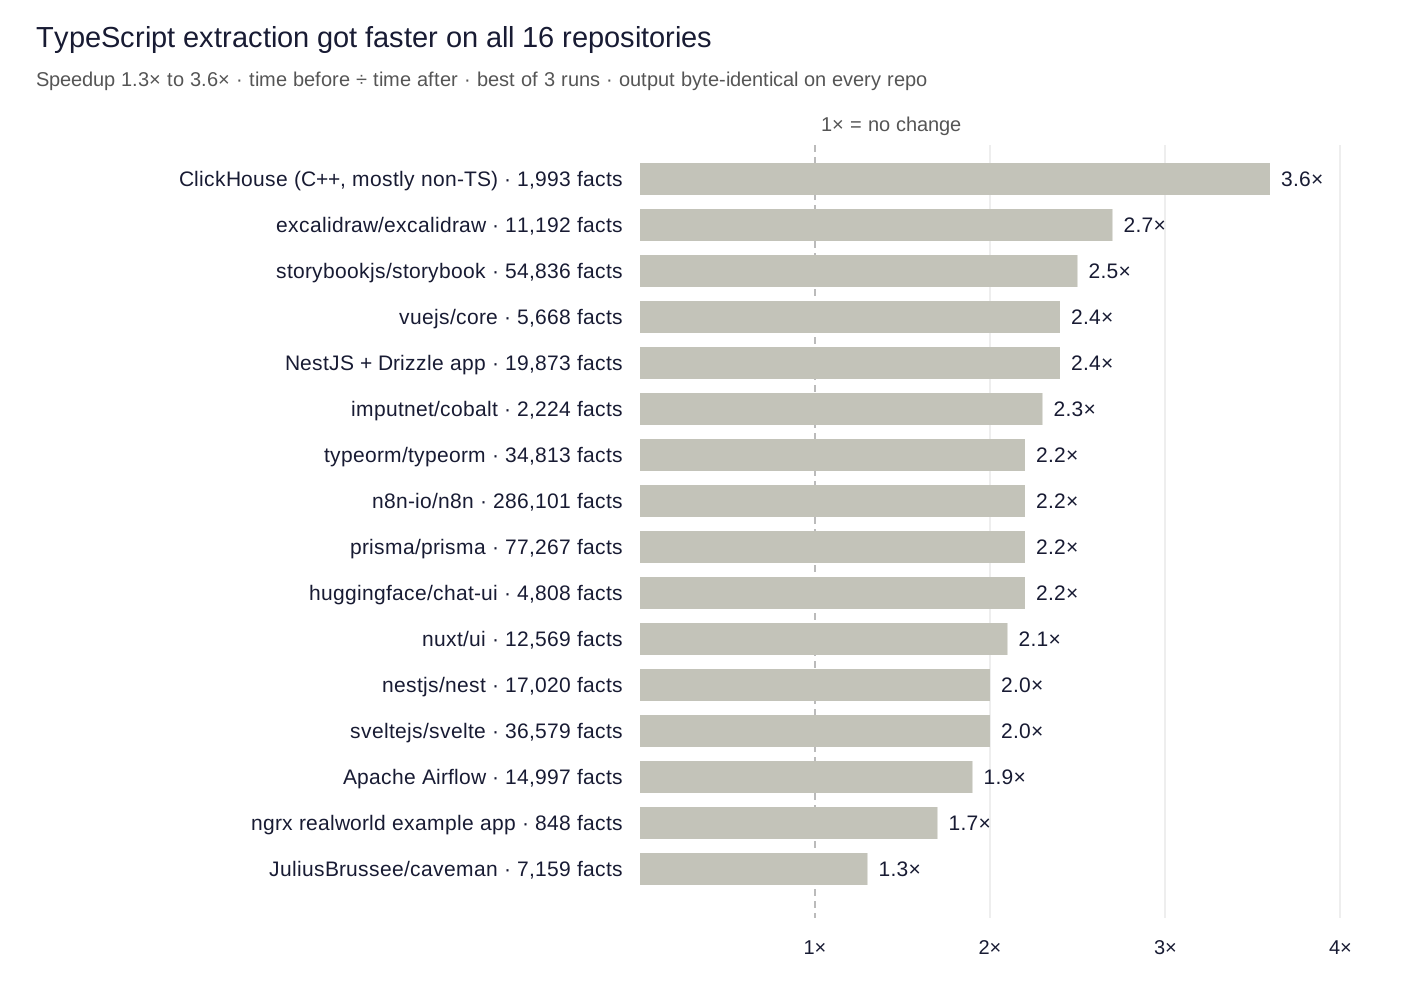
The allocator change also helps languages we did not touch: on the Codex repository, the Rust extractor dropped from 8.1 s to 6.9 s.
Running the full benchmark
I wanted to check the whole change, including the code outside TypeScript. We ran the full benchmark on 124 public repositories, from small libraries to the Linux kernel. The suite checks performance findings against human labels and measures indexing time. TypeScript is the largest group, with Angular, Vue and Svelte projects among them, and the rest are C and C++, C#, Dart, Go, Java, Kotlin, PHP, Python, Ruby, Rust, Scala and Swift. Every part compared a build of main with the new build.
- Grading: the performance findings, checked against the labels.
- Timing: a cold full snapshot of all 124, alternating the two builds, with a 15-minute cap per run. None hit it.
- Re-timing: the 16 largest repositories, again, with a warm-up and the median of repeated runs.
What changed in the findings
The benchmark reported 51,355 findings on main and 51,353 on the new build. We reviewed every change. Eight repositories changed, all because of the TypeScript work: 14 findings are new at high severity because the I/O is now confirmed, 3 are new at medium, and 19 false positives are gone.
| Repository | main → new | What changed |
|---|---|---|
| directus | 420 → 406 | 14 path.join and Array.join findings dropped |
| payload | 744 → 747 | 6 new, 3 dropped |
| spartacus (Angular) | 240 → 244 | 4 new, from services calling through facade interfaces |
| drizzle-orm | 324 → 327 | 3 new, confirmed I/O |
| n8n | 2,797 → 2,799 | 2 new |
| gauzy (Angular) | 1,006 → 1,004 | 2 dropped, Array.reduce calls that do no I/O |
| angular | 950 → 951 | 1 new at high severity: a stat call in a loop in the compiler's file-system code |
| thingsboard | 1,447 → 1,448 | 1 new, in its Angular front end |
Measuring the speedup
A single cold run of each of the 124 repositories took 1,698 s with main and 1,578 s with the new build (1.08×). Single runs turned out to be unreliable for large repositories, so we re-timed the 16 largest with a warm-up run and the median of two or three runs per build. None was slower on the new build.
| Repository | main | New build | Speedup |
|---|---|---|---|
| Peertube (Angular) | 47.0 s | 28.5 s | 1.65× |
| Storybook (TypeScript) | 6.3 s | 4.4 s | 1.44× |
| Nextcloud server (PHP) | 17.6 s | 12.8 s | 1.37× |
| n8n (TypeScript) | 46.1 s | 36.5 s | 1.27× |
| Grafana (Go) | 29.4 s | 24.0 s | 1.22× |
| Discourse (Ruby) | 40.6 s | 34.8 s | 1.17× |
| ClickHouse (C++) | 90.8 s | 83.8 s | 1.08× |
| .NET runtime (C#) | 90.5 s | 85.0 s | 1.06× |
| Roslyn (C#) | 32.5 s | 30.6 s | 1.06× |
| rust-lang/rust | 36.8 s | 34.8 s | 1.06× |
| Shopware (PHP) | 73.9 s | 70.1 s | 1.05× |
| Spark (Scala) | 18.3 s | 17.5 s | 1.05× |
| Dart SDK | 73.5 s | 70.7 s | 1.04× |
| GitLab (Ruby) | 242.5 s | 234.5 s | 1.03× |
| Linux kernel (C) | 232.0 s | 228.4 s | 1.02× |
| OpenProject (Ruby) | 36.9 s | 36.4 s | 1.01× |
| Sum of the 16 | 1,115 s | 1,033 s | 1.08× |
On ClickHouse, TypeScript extraction is 3.6× faster, but it handles only about 2,000 facts in a mostly C++ repository. The full snapshot improved from 90.8 s to 83.8 s, about 8%.
Checking the extracted facts
We also compared the facts behind the findings. The counts matched between the two builds on every repository except six that contain TypeScript: Angular's dashboard, NestJS, tRPC, TypeORM, Zod and Deno. Five differences came from the new detection, though TypeORM also had noise from its test fixtures. Deno was different: our speedup had dropped two dependency facts. We found and fixed that bug.
Bugs we introduced
Alongside the Deno bug, our benchmark and CI checks caught three more mistakes:
- A false-positive filter was too broad. It treated every
node:module as non-I/O, sonode:fscalls such aswriteFilestopped counting, and it skipped verbs likedelete, which cost a finding the labels mark as correct. The labelled run caught it. We narrowed the filter to the names that caused false positives and added a test. - The interface-member handling we added for TypeScript lives in code shared by every language, so Scala traits picked it up and gained three facts each. Comparing facts across languages caught it, and we made the behaviour opt-in, set only by the TypeScript extractor.
- The CI job that runs Enola on its own repository failed on a layer violation in our new code: the unresolved-call-site listing imported a linker package only to read two property names. We moved the names into the shared facts package, and the same run flagged, as advisory, a loop in our ORM detection that re-read each workspace
package.jsonthree times. It now stops as soon as all three ORMs are found.
These checks caught mistakes in our own code, including changes outside TypeScript that we had not intended. That gives me more confidence in the release.
Six functions in Ember, GraphQL and Vue support still have complexity scores of 40 or more. Those are next.
enola is open source under Apache 2.0. Free, local, no data leaves your machine.
curl -fsSL https://raw.githubusercontent.com/enola-labs/enola/main/install.sh | sh